the Strength of Migratory Connectivity in SongbirdsStudies of migratory connectivity use spatial data to link the breeding and non-breeding grounds of migratory species, and explore the extent to which different populations of the same species mix between different seasonal ranges and migratory routes. The Painted Bunting (Passerina ciris) is a small, charismatic songbird with a disjunct breeding range in North America: eastern Painted Buntings breed in coastal areas of the Carolinas, Georgia, and northern Florida, and molt their flight feathers before migrating to the southern tip of Florida, while interior Painted Buntings breed predominantly in Oklahoma, Texas Arkansas and Louisiana, and stop at staging grounds to molt before completing migration to Mexico and Central America.The eastern and western populations are separated by ~500 km and exhibit morphological differences in wing length. Recent genomic evidence suggests that two sympatric populations of Painted Bunting may exist within the interior population, indicating potential differences in migratory route, molt strategy, and/or mixing on the breeding and wintering ground.
In the summers of 2018 and 2019, I worked with Dr. Andrea Contina to band Painted Buntings across the western population range, collecting tissue samples for isotope and genomic analyses, and deploying light-level geolocators. Our updated understanding of Painted Bunting migratory connectivity (Sharp et al. 2022) can be read in the Journal of Field Ornithology. While capturing Painted Buntings for this project, we found a bird exhibiting a plumage aberration, which we were able to use to extrapolate post-molt movements. Check out that paper (Besozzi et al. 2021) at the Wilson Journal of Ornithology. |
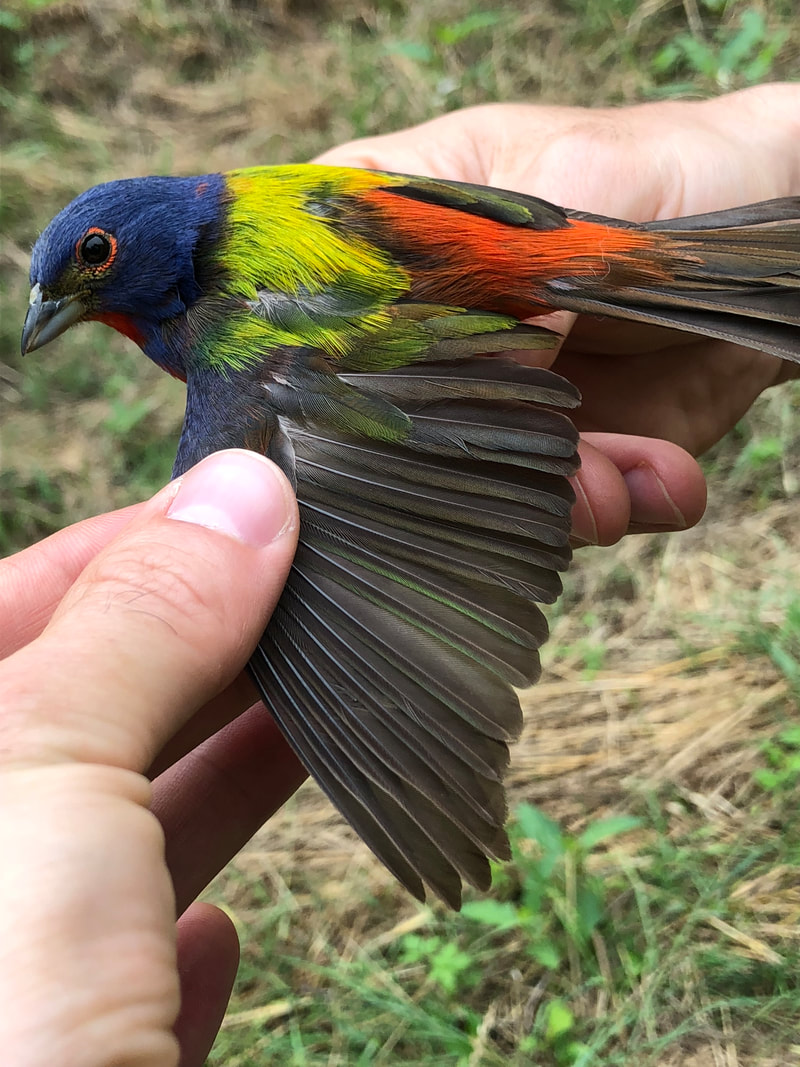
Painted Bunting, interior population
(all birds handled by trained banders and released at point of capture)
|
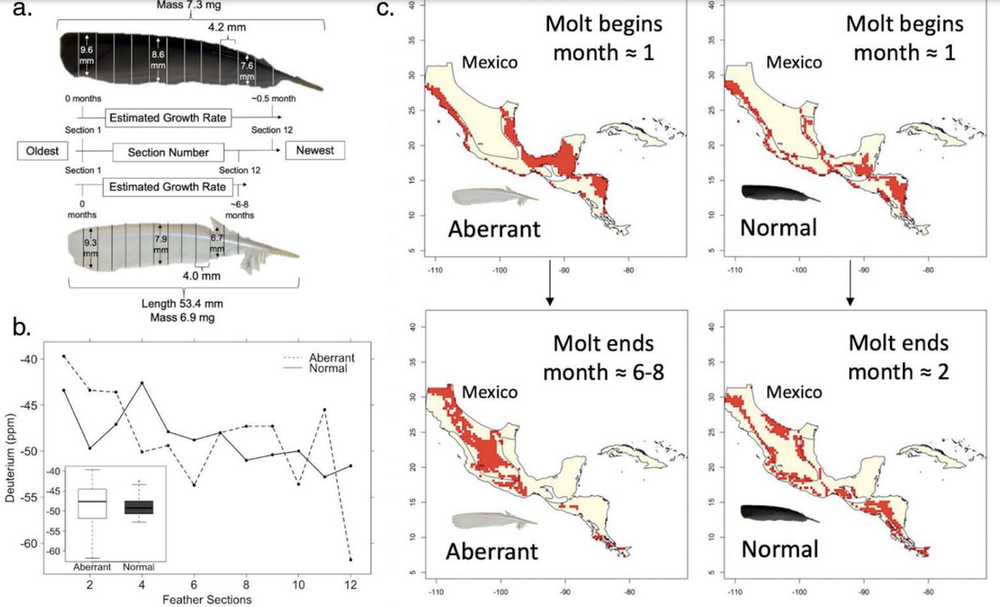
Figure 2 from Besozzi et al. 2021. (a) Normal (right p1) and aberrant (left p3) primary feather dimensions, estimated growth rates, and sectioning scheme of adult male Painted Bunting left wing feather captured in southern Oklahoma in 2018. (b) Line graph of heavy hydrogen depletion in part per mil (ppm) across 12 cross-sections of the aberrant (dashed line) and control (solid line) feathers. Analogous feather sections represent different estimated time steps across total growth period (aberrant ∼6–8 months vs. normal ∼4–6 weeks). Subset boxplot shows intra-feather variation in heavy hydrogen richness across sections. (c) Posterior probability density estimation of molt locations in Central America for the aberrant (left) and normal (right) feathers, with estimated growing periods. Top 10% posterior probability density estimates are plotted in red indicating high likelihood of molting areas.
